
Prometheus Operator 安装配置
Prometheus Operator 安装配置
一、概述
首先Prometheus整体监控结构略微复杂,一个个部署并不简单。另外监控Kubernetes就需要访问内部数据,必定需要进行认证、鉴权、准入控制,
那么这一整套下来将变得难上加难,而且还需要花费一定的时间,如果你没有特别高的要求,还是建议选用开源比较好的一些方案。
在k8s初期使用Heapster+cAdvisor方式监控,这是Prometheus Operator出现之前的k8s监控方案。后来出现了Prometheus Operator,但是目前Prometheus Operator已经不包含完整功能,完整的解决方案已经变为kube-prometheus。项目地址为:
https://github.com/prometheus-operator/kube-prometheus
关于kube-prometheus目前应该是开源最好的方案了,该存储库收集Kubernetes清单,Grafana仪表板和Prometheus规则,以及文档和脚本,以使用Prometheus Operator 通过Prometheus提供易于操作的端到端Kubernetes集群监视。以容器的方式部署到k8s集群,而且还可以自定义配置,非常的方便。
首先我们先来了解下 Prometheus Operator 的架构图:
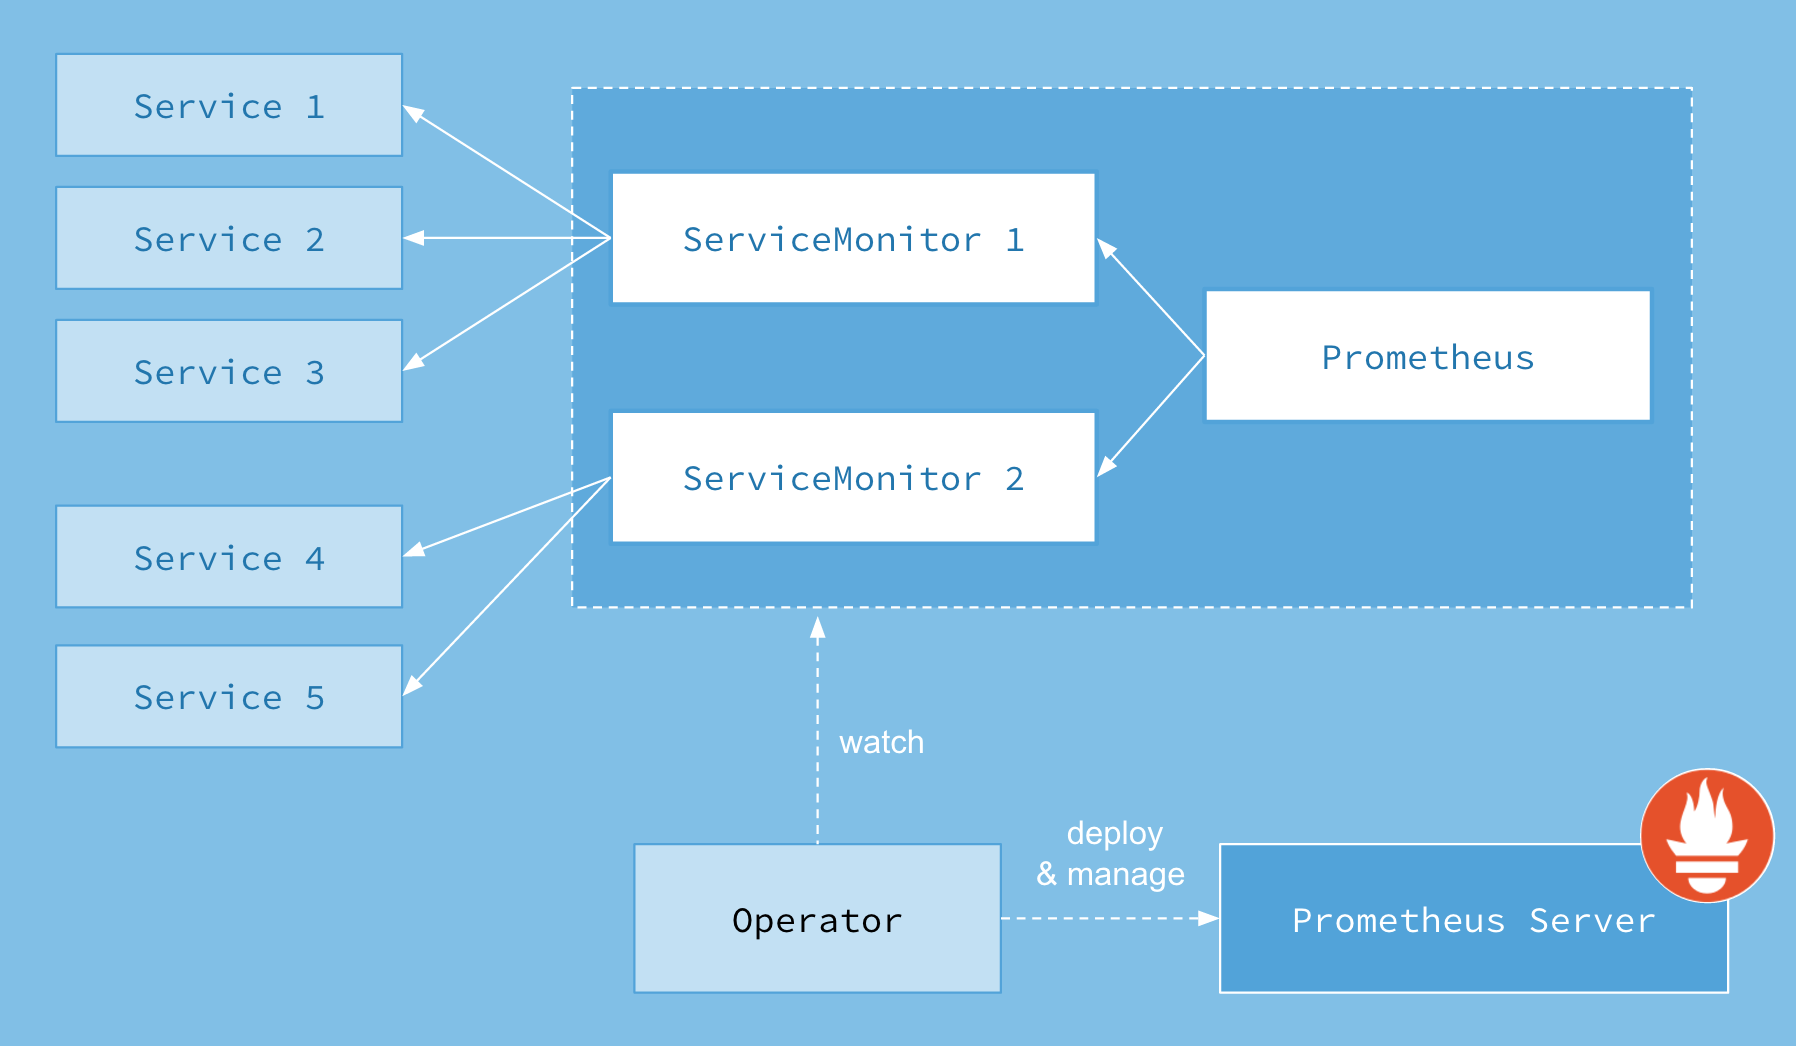
上图是 Prometheus-Operator 官方提供的架构图,各组件以不同的方式运行在 Kubernetes 集群中,其中 Operator 是最核心的部分,作为一个控制器,他会去创建 Prometheus、ServiceMonitor、AlertManager 以及 PrometheusRule 等 CRD 资源对象,然后会一直 Watch 并维持这些资源对象的状态。
在最新版本的 Operator 中提供了一下几个 CRD 资源对象:
PrometheusAlertmanagerServiceMonitorPodMonitorProbeThanosRulerPrometheusRuleAlertmanagerConfig
这里面我们用的最多的三个 crd 就是 PodMonitor、ServiceMonitor、PrometheusRule
Prometheus
该 CRD 声明定义了 Prometheus 期望在 Kubernetes 集群中运行的配置,提供了配置选项来配置副本、持久化、报警实例等。
对于每个 Prometheus CRD 资源,Operator 都会以 StatefulSet 形式在相同的命名空间下部署对应配置的资源,Prometheus Pod 的配置是通过一个包含 Prometheus 配置的名为 <prometheus-name> 的 Secret 对象声明挂载的。
该 Secret 以 prometheus.yaml.gz 为 key 的方式保存使用配置文件。
该 CRD 根据标签选择来指定部署的 Prometheus 实例应该覆盖哪些 ServiceMonitors,然后 Operator 会根据包含的 ServiceMonitors 生成配置,并在包含配置的 Secret 中进行更新。
如果未提供对 ServiceMonitor 的选择,则 Operator 会将 Secret 的管理留给用户,这样就可以提供自定义配置,同时还能享受 Operator 管理 Operator 的设置能力。
Alertmanager
该 CRD 定义了在 Kubernetes 集群中运行的 Alertmanager 的配置,同样提供了多种配置,包括持久化存储。
对于每个 Alertmanager 资源,Operator 都会在相同的命名空间中部署一个对应配置的 StatefulSet,Alertmanager Pods 被配置为包含一个名为 <alertmanager-name> 的 Secret,该 Secret 以 alertmanager.yaml 为 key 的方式保存使用的配置文件。
当有两个或更多配置的副本时,Operator 会在高可用模式下运行 Alertmanager 实例。
ThanosRuler
该 CRD 定义了一个 Thanos Ruler 组件的配置,以方便在 Kubernetes 集群中运行。通过 Thanos Ruler,可以跨多个Prometheus 实例处理记录和警报规则。
一个 ThanosRuler 实例至少需要一个 queryEndpoint,它指向 Thanos Queriers 或 Prometheus 实例的位置。queryEndpoints 用于配置 Thanos 运行时的 --query 参数,更多信息也可以在 Thanos 文档中找到。
ServiceMonitor
该 CRD 定义了如何监控一组动态的服务,使用标签选择来定义哪些 Service 被选择进行监控。这可以让团队制定一个如何暴露监控指标的规范,然后按照这些规范自动发现新的服务,而无需重新配置。
为了让 Prometheus 监控 Kubernetes 内的任何应用,需要存在一个 Endpoints 对象,Endpoints 对象本质上是IP地址的列表,通常 Endpoints 对象是由 Service 对象来自动填充的,Service 对象通过标签选择器匹配 Pod,并将其添加到Endpoints 对象中。一个 Service 可以暴露一个或多个端口,这些端口由多个 Endpoints 列表支持,这些端点一般情况下都是指向一个 Pod。
Prometheus Operator 引入的这个 ServiceMonitor 对象就会发现这些 Endpoints 对象,并配置 Prometheus 监控这些 Pod。ServiceMonitorSpec 的 endpoints 部分就是用于配置这些 Endpoints 的哪些端口将被 scrape 指标的。
⚠️ endpoints(小写)是 ServiceMonitor CRD 中的字段,而 Endpoints(大写)是 Kubernetes 的一种对象。
ServiceMonitors 以及被发现的目标都可以来自任何命名空间,这对于允许跨命名空间监控的场景非常重要。使用 PrometheusSpec 的 ServiceMonitorNamespaceSelector,可以限制各自的 Prometheus 服务器选择的 ServiceMonitors 的命名空间。使用 ServiceMonitorSpec 的 namespaceSelector,可以限制 Endpoints 对象被允许从哪些命名空间中发现,要在所有命名空间中发现目标,namespaceSelector 必须为空:
spec:
  namespaceSelector:
    any: true
PodMonitor
该 CRD 用于定义如何监控一组动态 pods,使用标签选择来定义哪些 pods 被选择进行监控。同样团队中可以制定一些规范来暴露监控的指标。
Pod 是一个或多个容器的集合,可以在一些端口上暴露 Prometheus 指标。
由 Prometheus Operator 引入的 PodMonitor 对象会发现这些 Pod,并为 Prometheus 服务器生成相关配置,以便监控它们。
PodMonitorSpec 中的 PodMetricsEndpoints 部分,用于配置 Pod 的哪些端口将被 scrape 指标,以及使用哪些参数。
PodMonitors 和发现的目标可以来自任何命名空间,这同样对于允许跨命名空间的监控用例是很重要的。使用 PodMonitorSpec 的 namespaceSelector,可以限制 Pod 被允许发现的命名空间,要在所有命名空间中发现目标,namespaceSelector 必须为空:
spec:
  namespaceSelector:
    any: true
PodMonitor 和 ServieMonitor 最大的区别就是不需要有对应的 Service。
Probe
该 CRD 用于定义如何监控一组 Ingress 和静态目标。除了 target 之外,Probe 对象还需要一个 prober,它是监控的目标并为 Prometheus 提供指标的服务。例如可以通过使用 blackbox-exporter 来提供这个服务。
PrometheusRule
用于配置 Prometheus 的 Rule 规则文件,包括 recording rules 和 alerting,可以自动被 Prometheus 加载。
AlertmanagerConfig
在以前的版本中要配置 Alertmanager 都是通过 Configmap 来完成的,在 v0.43 版本后新增该 CRD,可以将 Alertmanager 的配置分割成不同的子对象进行配置,允许将报警路由到自定义 Receiver 上,并配置抑制规则。
AlertmanagerConfig 可以在命名空间级别上定义,为 Alertmanager 提供一个聚合的配置。
这样我们要在集群中监控什么数据,就变成了直接去操作 Kubernetes 集群的资源对象了,是这样比之前手动的方式就方便很多了。
二、安装
我们可以使用 Prometheus 社区维护的 Helm 图表来部署 Prometheus Operator,他进一步简化了安装,默认封装好了 etcd,scheduler,controller-manager 的 svc,拆分了 PrometheusRule 等,所以我们安装 Prometheus Operator 可以用 helm chart,后续的维护 直接新建 crd 的yaml 文件进行更新。
https://github.com/prometheus-community/helm-charts
Helm 获取压缩包
添加 helm repo
helm repo add prometheus-community https://prometheus-community.github.io/helm-charts
下拉压缩包
⚠️ kube-prometheus-stack 版本请根据 k8s 版本具体选择,否则会出现不兼容问题
helm pull prometheus-community/kube-prometheus-stack --version 23.3.2
tar -xvf kube-prometheus-stack-23.3.2.tgz
cd kube-prometheus-stack/
Prometheus 安装配置
为 prometheus 创建 Namespace
ns 为 cattle-prometheus 的原因,是方便 rancher 收集 做可视化,如无需求,可自定义 ns
kubectl create namespace cattle-prometheus
修改 kube-proxy 的configmap
将 metricsBindAddress 修改为 "0.0.0.0:10249"
kubectl -n kube-system edit configmaps kube-proxy
kubectl rollout restart ds kube-proxy -n kube-system
由于 现状 本来就使用的https ,所以要新增认证,如果是新建的,可以使用http,具体步骤见下 "etcd http 模式"
etcd https 模式
新增 etcd secret
kubectl create secret generic etcd-certs -n cattle-prometheus --from-file=/etc/kubernetes/pki/etcd/ca.crt --from-file=/etc/kubernetes/pki/etcd/healthcheck-client.crt --from-file=/etc/kubernetes/pki/etcd/healthcheck-client.key
部署
helm install monitoring -n cattle-prometheus --set kubeEtcd.serviceMonitor.scheme=https --set kubeEtcd.serviceMonitor.caFile=/etc/prometheus/secrets/etcd-certs/ca.crt --set kubeEtcd.serviceMonitor.certFile=/etc/prometheus/secrets/etcd-certs/healthcheck-client.crt --set kubeEtcd.serviceMonitor.keyFile=/etc/prometheus/secrets/etcd-certs/healthcheck-client.key --set prometheus.prometheusSpec.secrets={etcd-certs} --set prometheusOperator.admissionWebhooks.patch.image.sha=null ./
在 node 上下拉镜像
由于镜像在国外kube-state-metrics:v2.2.4、kube-webhook-certgen:v1.0,我拉取下来放到 国内可达的仓库地址
etcd http 模式
将 --listen-metrics-urls= 值 改为 http://ip:2381,要新增,不要修改127.0.0.1,实例
    #- --listen-metrics-urls=http://127.0.0.1:2381
    - --listen-metrics-urls=http://127.0.0.1:2381,http://ip:2381
部署
helm install monitoring -n cattle-prometheus --set kubeEtcd.service.port=2381 --set kubeEtcd.service.targetPort=2381 --set prometheusOperator.admissionWebhooks.patch.image.sha=null ./
查找 grafana admin 账户密码
kubectl -n cattle-prometheus get secrets monitoring-grafana -o jsonpath="{.data.admin-password}" | base64 --decode ; echo
三、配置报警
为了统一发送告警的位置,建议 k8s 外部搭建 alertmanager 高可用集群,告警组分类,应该按照 appid 的维度进行告警,告警规则应该关联上 appid 的标签
在 prometheus 所在的 namespace 下创建 alertmanager 的外部服务
创建外部服务映射到 k8s:
kind: Service
apiVersion: v1
metadata:
  name: alertmanager-ext
  namespace: cattle-prometheus
spec:
  ports:
  - name: web
    port: 9093

---
kind: Endpoints
apiVersion: v1
metadata:
  name: alertmanager-ext
  namespace: cattle-prometheus
subsets:
  - addresses:
      - ip: xx
      - ip: xx
    ports:
      - name: web
        port: 9093
修改prometheus使用的AlertManger
kubectl -n cattle-prometheus edit prometheus monitoring-kube-prometheus-prometheus
spec:
  alerting:
    alertmanagers:
    - apiVersion: v2
      name: alertmanager-ext
      namespace: cattle-prometheus
      pathPrefix: /
      port: web
prometheus-alert-history 可以用开源项目 alertsnitch
四、问题处理
- controller-manager ,scheduler targes 收集异常 可以注释 manifest 中的 --port=0 参数
参考链接
- https://tech.meipian.cn/k8sjian-kong-zhong-ji-jie-jue-fang-an/
- https://www.qikqiak.com/k8strain2/monitor/operator/install/
- https://github.com/prometheus-operator/prometheus-operator/blob/main/Documentation/user-guides/alerting.md